Resources · Guide 09 · DATA
Turn a hand-drawn table into a clean dashboard
Photograph a table from your notebook (sales, habits, a budget, a workout log) and Claude reads the numbers, checks them with you, then builds a dashboard: bar chart, habit heatmap, budget donut and a line chart that flags a new personal best, all on one screen. The charts are code, so every number on them is calculated from your data. This is how the dashboard in the reel was made.
What you'll make
- Your table typed up and checked with you before anything is charted
- The right chart for each table: bars, heatmap, donut or line
- Headline numbers worked out from your data, with every comparison labelled
- Everything on one screen, as a single HTML file that works on your phone
What you need
Claude
Reads the table, checks the numbers with you and builds the dashboard (as an artifact in claude.ai, or as a file in Claude Code)
Your table
A photo of the notebook page, a screenshot, or a CSV export
Step by step
6 steps-
Write the table clearly and photograph it
One table per page, with a title, column headings and units. In the reel the tables were "sales.xlsx" (month and sales), "habits" (four habits, a cross or a dash for each day), "budget - oct" (what and £) and "squat log" (week and kg).
Write numbers clearly and photograph straight on in good light. A blurry 1 that looks like a 7 will end up on your chart.
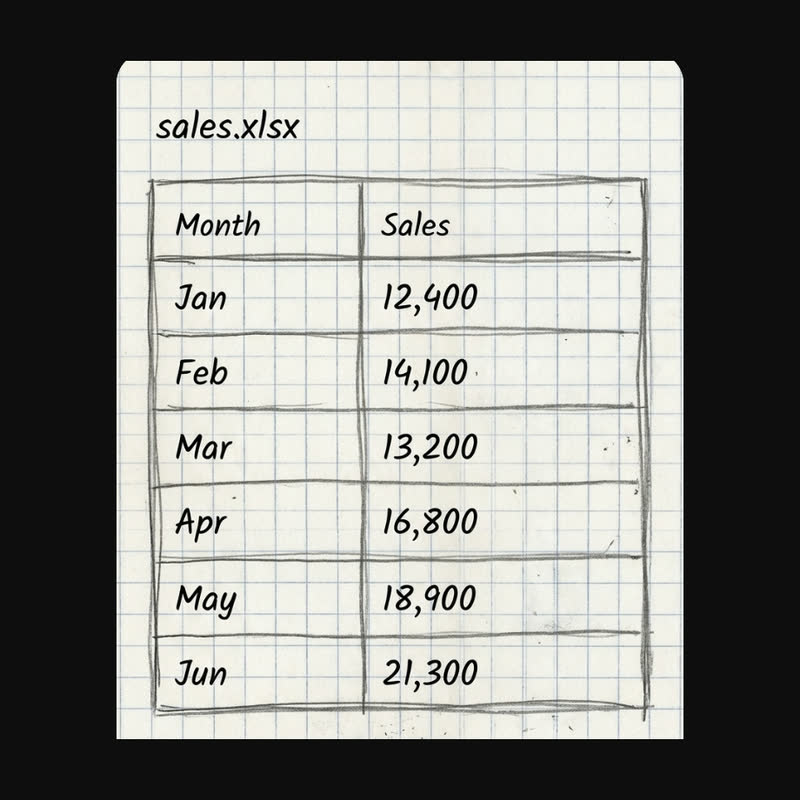 sales.xlsx
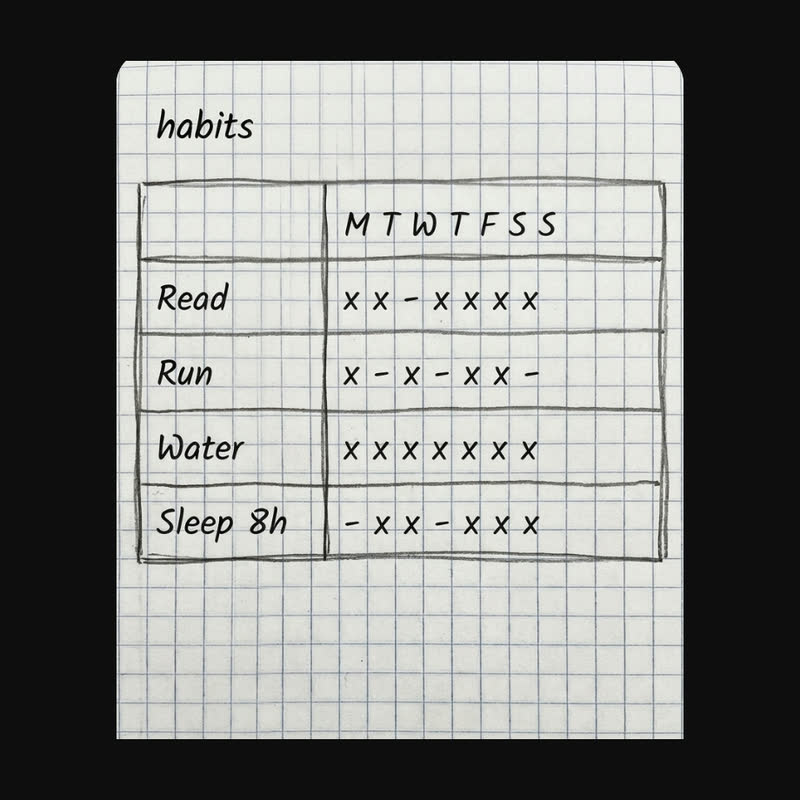 habits
Two of the tables in the reel: a title, column headings and clear numbers or marks, one table per page. -
Have Claude type it up and check it with you
This is the step that matters most. Ask Claude to transcribe the table before it draws anything, and to mark anything it isn't sure of. Read it against your page and correct it.
Only say "go" when the numbers match. A good-looking chart of the wrong numbers is worse than no chart.
Ask ClaudeHere is a photo of my table. Don't make any charts yet. First type it up as a table exactly as written, including units and blanks. Mark anything you're not sure about with (?) and tell me what you think it says. Add up any columns that have a total so I can compare. Then wait for me to confirm.
-
Ask for the right chart for each table
Values over time suit bars. Yes/no per day suits a heatmap. Parts of a whole suit a donut. A measurement that keeps changing suits a line. Claude can choose, but it helps to say what you want to see at a glance, for example "am I getting stronger?" or "where does the money go?".
Ask ClaudeThose numbers are right. Build a dashboard as a single HTML file: bars for values over time (latest period in full colour, earlier ones faded), a green/grey heatmap for yes/no per day, a donut with a legend for parts of a whole, and a line with points for anything I'm tracking upwards, with a "New PR" badge if the last value is the best. White rounded cards on a light grey page, Inter font, one blue accent.
-
Make every number earn its place
A headline number on each card makes a dashboard readable in a second: the total, the streak, the latest value. Ask Claude to calculate them from the data and to say what every percentage compares. "+44%" means nothing; "+44% Apr–Jun vs Jan–Mar" means something.
Ask for a "Check the numbers" panel that shows the raw tables, so anyone looking at the dashboard can see where each figure came from.
Ask ClaudeAdd a headline number to each card, calculated from the data, never typed in: the total for sales and budget, the longest current streak for habits, the latest value for the lift. Label every comparison with what it compares. Add a collapsible "Check the numbers" panel with the raw tables. Then re-add the totals yourself and tell me they match.
-
Put it all on one screen
Ask for the combined view: two small cards side by side on top, the wider charts underneath, and one column on a phone. Open it on your phone and check nothing scrolls sideways.
Ask ClaudePut all four cards on one screen: the two smaller charts side by side, the heatmap and the line chart full width below. One column on phones. Cards pop in and the numbers count up when the page opens, but no animation for people who turn motion off.
-
Keep it up to date
Ask Claude to keep all the numbers in one block at the top of the file. Next month, add a row there yourself, or send Claude a new photo and ask it to update only the data.
The prompts behind the reel
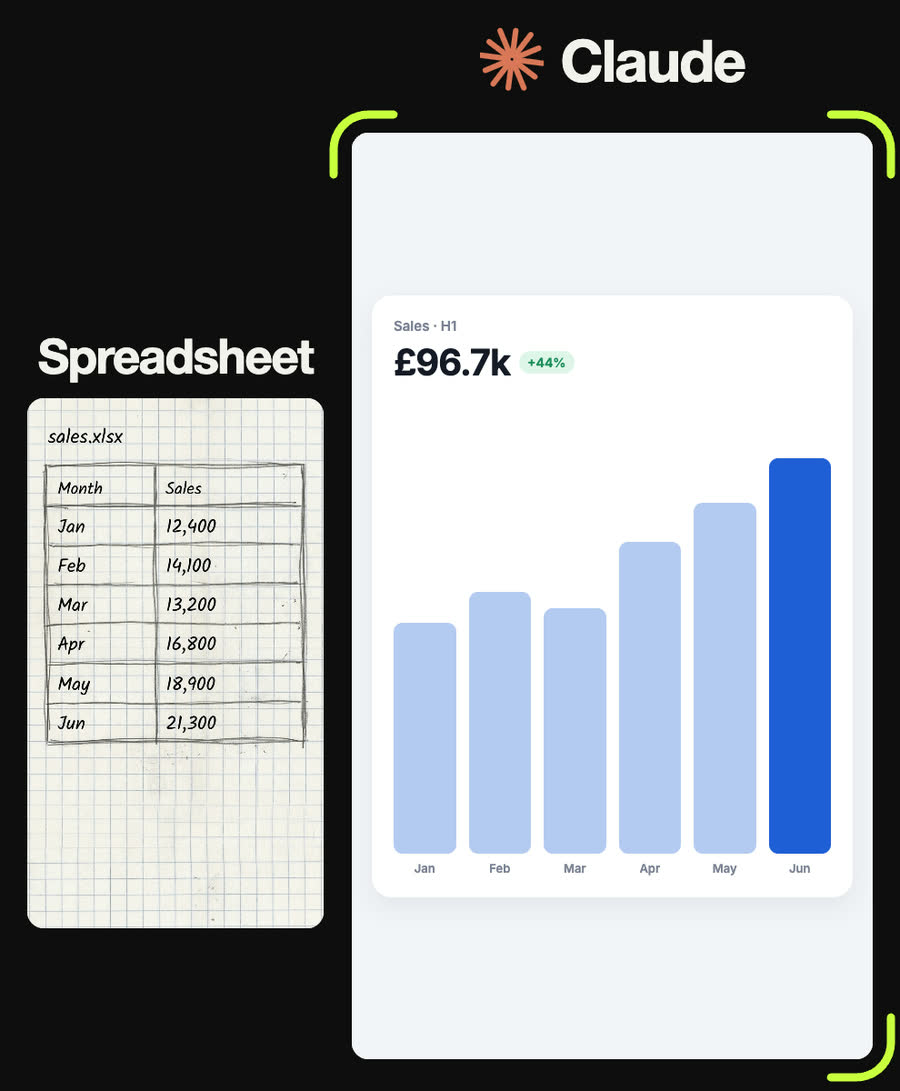
My sales table: Jan 12,400, Feb 14,100, Mar 13,200, Apr 16,800, May 18,900, Jun 21,300 (£). Card titled "Sales · H1" with the total as the headline (£96.7k), a green chip with the change from Jan–Mar to Apr–Jun, labelled, and six rounded bars with June in full blue and the earlier months faded.
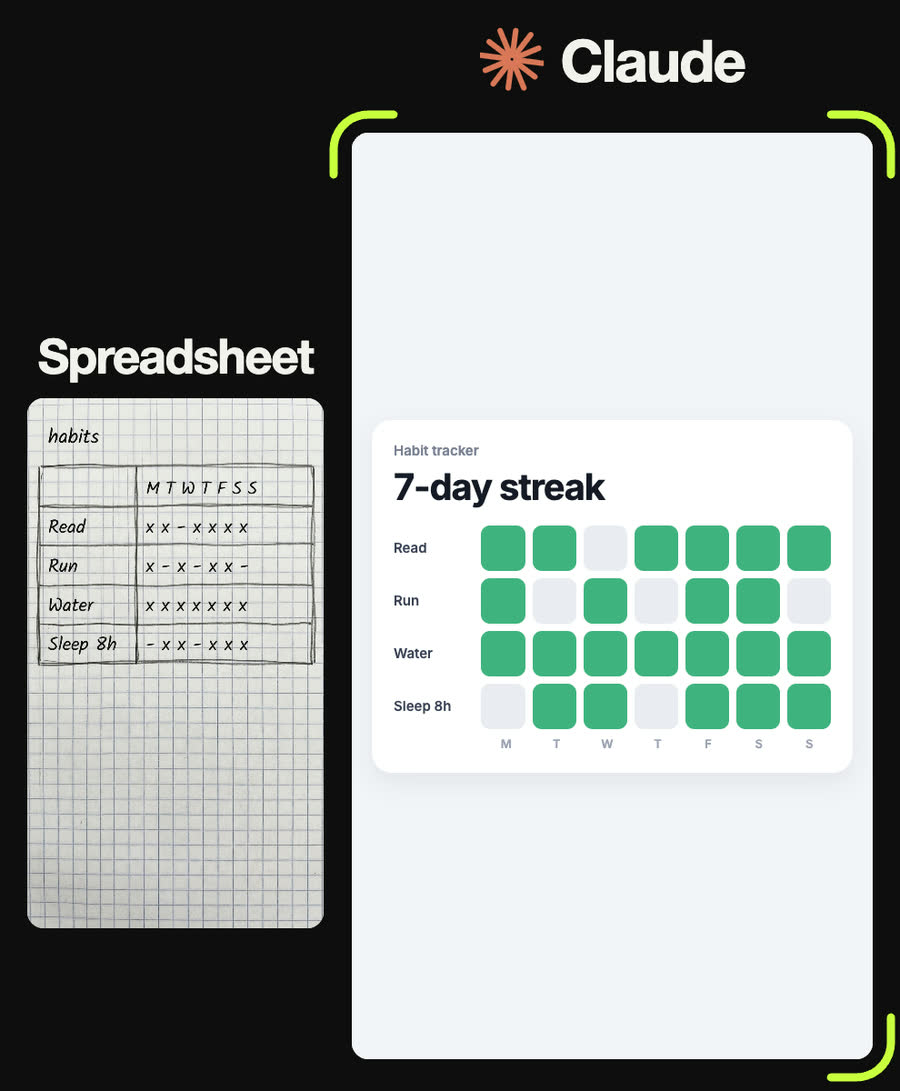
Habits for one week (x = done, - = missed). Read: x x - x x x x. Run: x - x - x x -. Water: x x x x x x x. Sleep 8h: - x x - x x x. Make a grid of rounded squares, green for done and light grey for missed, habit names on the left, M T W T F S S underneath. Headline: the longest current streak and how many of the 28 were done.
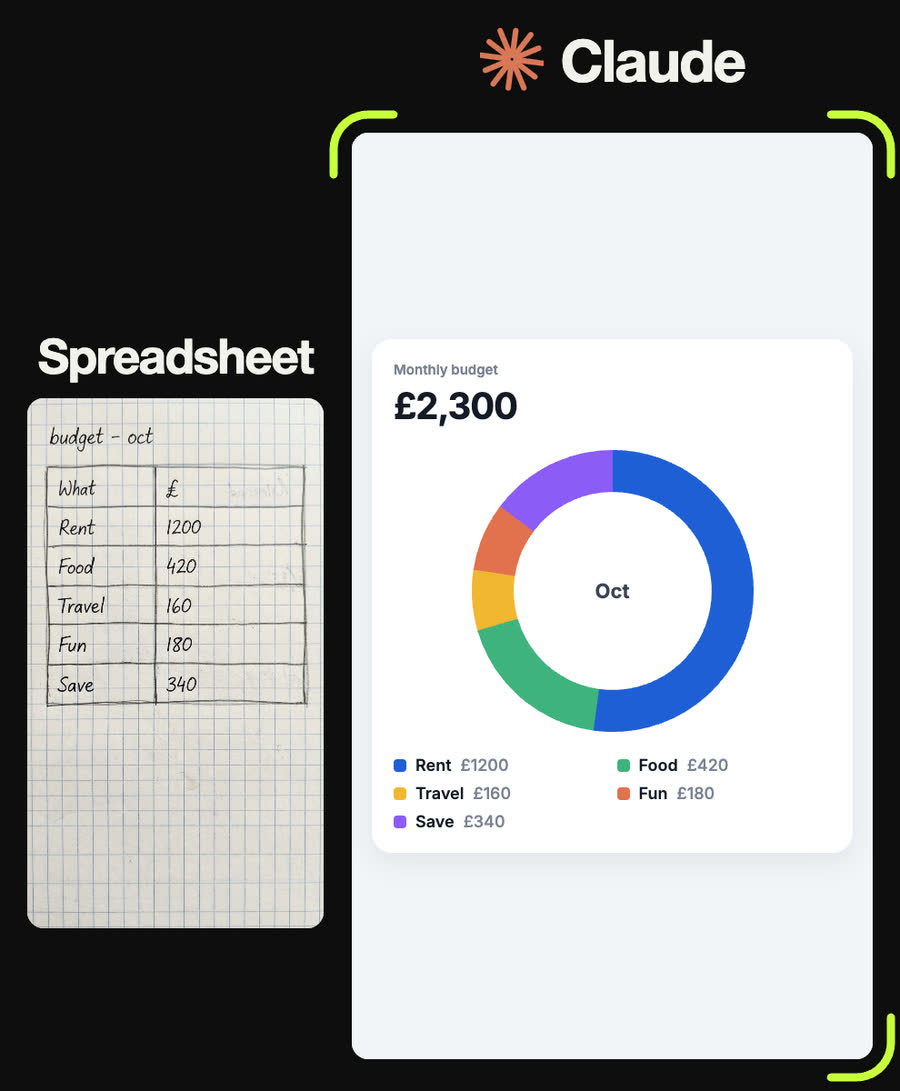
October budget: Rent 1200, Food 420, Travel 160, Fun 180, Save 340 (£). A donut starting at 12 o'clock in that order, five distinct colours, "Oct" in the middle, the £2,300 total as the headline, and a two-column legend with each amount.
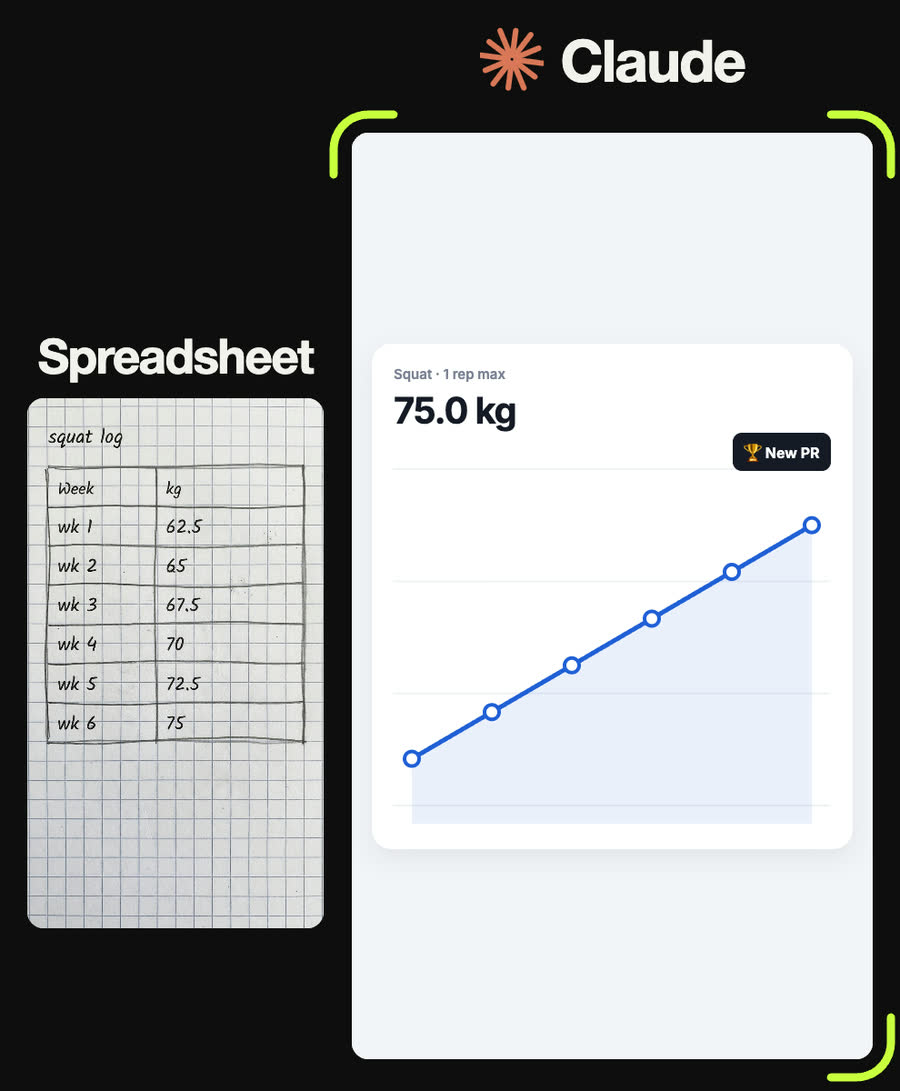
Squat one-rep max by week: 62.5, 65, 67.5, 70, 72.5, 75 kg. A blue line with white-filled points and a light blue area underneath, scaled so the climb fills the card. Headline 75.0 kg, a chip with the gain since week 1, and a dark "🏆 New PR" badge because the last value is the best.
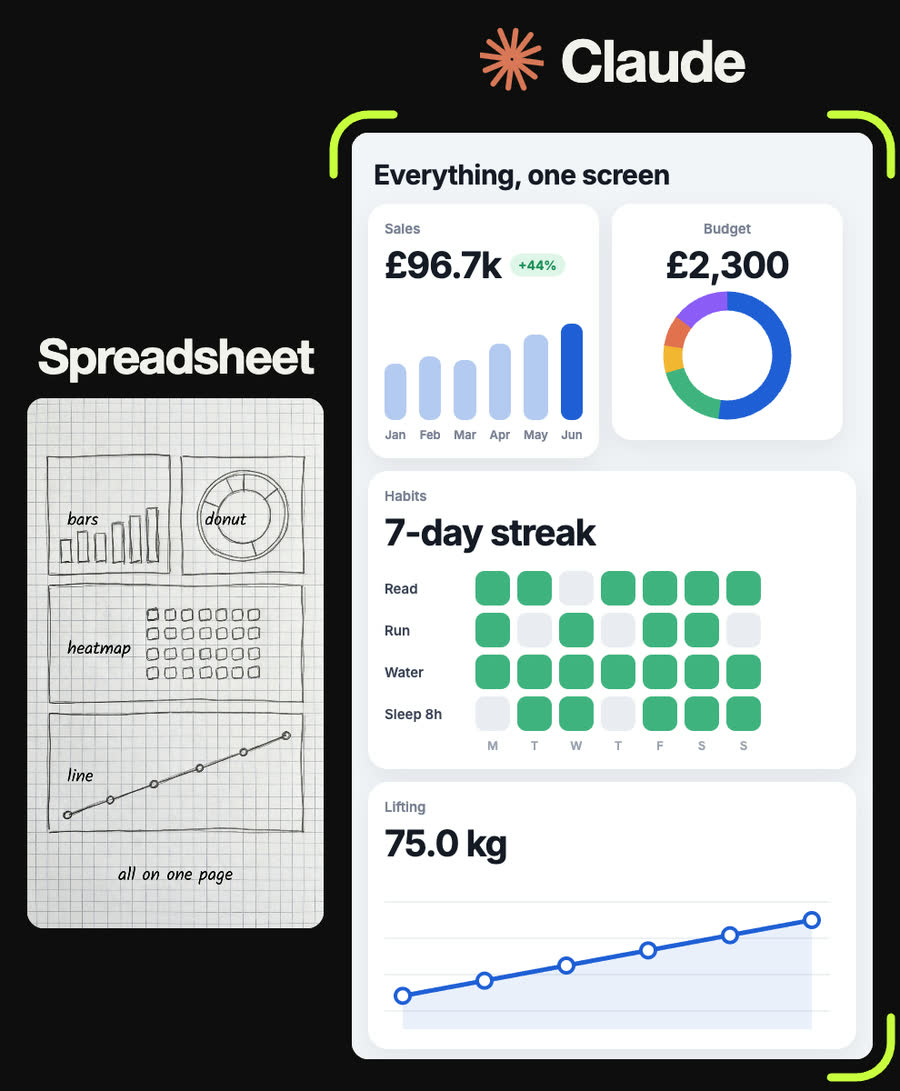
Combine the four into one dashboard titled "Everything, one screen": sales and budget side by side on top, habits and squat full width below, one column on a phone, plus a "Check the numbers" panel with the raw tables.
Tips
- Never skip the check. Ask Claude to type the table up and confirm it before charting, every time.
- Write units on the page (£, kg, hours). They end up in the headline numbers.
- Ask what each percentage compares. If Claude can't say, the number shouldn't be on the card.
- Highlight one thing per chart, such as the latest month. If every bar is bright, nothing stands out.
- Keep the data in one block at the top of the file so updating next month is a one-line change.
Claude skill
Do it in one go with the spreadsheet-to-dashboard skill
Give Claude a photo of a table and it transcribes it, flags anything unclear and waits for you to confirm, then builds a one-file dashboard with the right chart per table and every headline number calculated from the data. Includes the reel's measured spec and a working starter where you only edit the data block.
Download spreadsheet-to-dashboard.zipIn Claude (web or desktop app)
- Open Settings → Capabilities and make sure code execution is on.
- Under Skills, choose Upload skill and pick the zip.
- Start a chat, attach a photo of your input, and ask for the result. Claude uses the skill on its own.
In Claude Code
- Unzip it into
~/.claude/skills/(or.claude/skills/in a project). - Restart Claude Code and ask for the result. The skill loads when it fits.